Drawing bending moment and shearing force diagrams
The diagrams M and Q are drawn to clearly imagine the character of the bending moment and the shearing force change along the bar length and to find the dangerous sections. The drawing technique of the diagrams is considered by the following examples.
Example. Draw the diagram M and Q for the cantilever beam (Fig. 5.8 a).
Solving. There are two regions (  and BC), differing by the load character, hence, also by and the change law
  and Q.
| а) b) c) |
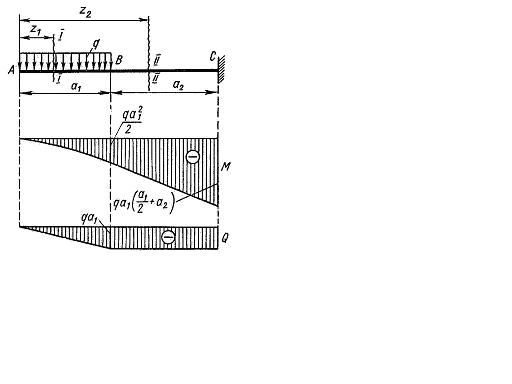
Fig. 5.8.
The bending moment at the section of the region a distance z1 to the right of А is found by the moment of the left force. For that purpose the distributed load to the left of the section is replaced by the resultant force qz1 as applied in the middle of the region over the length z1. We get
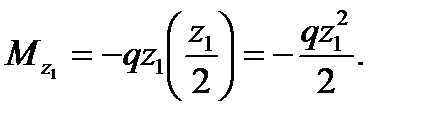 (5.6)
(5.6)
The minus sign is necessary because the beam tends to bend concave downward. It is the parabola equation. The parabola is drawn by approximately three points:
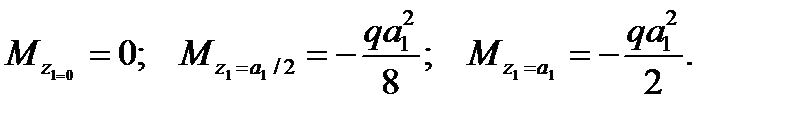 (5.7)
(5.7)
Do a section on the region ВС at a distance z2 to the free bar end. Replace the distributed load along the length а1 by the resultant force  applied in the middle of the region АВ. The moment at the section is
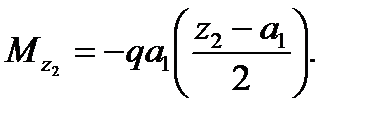 (5.8)
(5.8)
This is the equation of the straight line. Determine  for two values z:
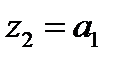 and
and 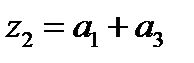
Then we get
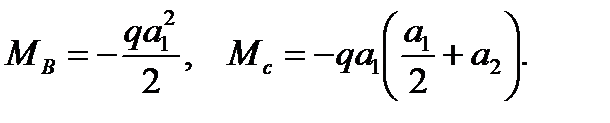 (5.9)
(5.9)
The diagram М is given in Fig. 5.8 b.
The shearing force at the section / — / is equal to 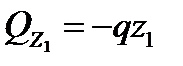 as the sum of the projection on the vertical line of the force located to the left of the section.
The shearing force at the section //—// is equal to 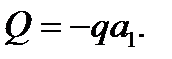
The diagram  is given in Fig. 5.8 c.
Дата добавления: 2020-10-25; просмотров: 794;
Поиск по сайту
Узнать еще
- As we can see the shearing strain and shearing stress in torsion are directly proportional to the distance from the centroid of the section.
- Axial moment of inertia
- Bending in two planes (non-uniplanar bending)
- Combined axial tension (compression) and bending
- Combined torsion and bending
- Determining the internal forces by the method of sections. Stresses
- Example of the shaft calculation in bending with torsion
Публикации по технике и механике
Публикации по биологии
Публикации по информатике
Публикации по строительству
Публикации по физике
Публикации по химии
Публикации по электронике

Публикации по искусству
Публикации по географии
Публикации по медицине