Laboratory work № 2
“Analysis of the buckling bar resistance”
Introduction
At equibalance or bodies movement, temporary additional small agitation arises. Depending on the state the body acquires after the agitation, it is said that a body is in a stable or unstable state.
The mathematical theory of stability was developed by A.M.Lyapunov, the buckling bar resistance was researched by L. Euler.
Stable, indifferent equilibrium and unstable equilibrium can be shown by the example of three states of the ball equilibria. A ball is put on the bottom of the pit, and then it is replaced a bit and released. After some balancing the ball returns to the initial position. In the second test a ball is put on the horizontal surface and then it is replaced a bit. After the ball is released, it remains in the initial position. Finally, the ball is put on the top of the bumpy surface and then it is replaced a bit. The ball goes down and does not return to the initial position. These tests show: the first state of equilibrium is stable, the second state of equilibrium is indifferent, and the third state of equilibrium is unstable.
Therefore aside strength and hardness provision, it is necessary to calculate the structural stability.
Theory
The stability is understood as the system property to keep its state under external actions. The stability of the initial equilibrium shape is a special case of the general stability. If this property does not remain, the system will be unstable.
Let us imagine the following perfect system. The homogeneous bar, having the constant cross section, is subjected to axial compression (Fig.1). We gradually increase the axial force adding loads 4 and apply the temporary Fв force normal to the bar axis.
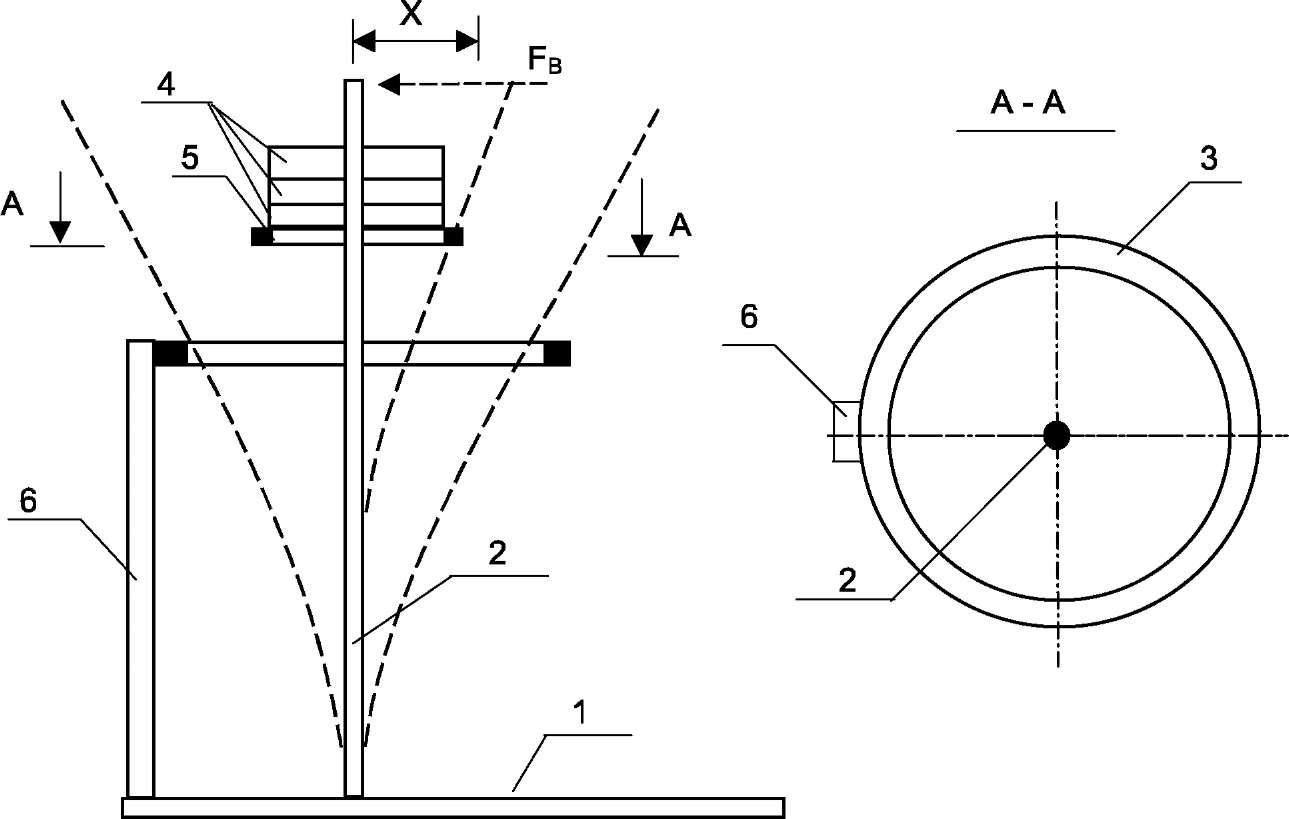
Fig. 1. Modelling stable and unstable states
of the compression bar
1 - base, 2 - test bar 3 - restrictive ring,
4 - loads, 5 - load place, 6 - upright
Under the initial values of a compressive force the bar goes to the rectilinear eguilibrium shape bringing to effect some oscillations (dotted axes), lateral force removed. In this case the elastic strain energy of the bending is greater than the work of the compressive force causing the curvature of the bar.
The subsequent increase of the compressive load (adding loads 4) may cause such a state of the bar under which the bar does not bring to effect the initial rectilinear shape and remains curved after the lateral temporary force has been acted. This new equilibrium state (under the absence of the material yield) is more complicated unlike the first one, because there also arise the bending stresses. There is the some critical intermediate position between these two positions and the load corresponding to it is critical. There is a theoretical possibility of the rectilinear equilibrium shape but it is unstable and transfers into a new equilibrium state, a curved one, under the smallest action.
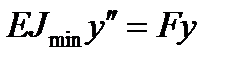
L. Euler defined the critical force as capable to keep a bar in a slightly curved state whose axis is given by the differential equation
 (1)
(1)
where E is the modulus of elasticity,
Imin is the minimum second moment of the cross-sectional area,
F is the axial compressive force,
y is the bar deflection.
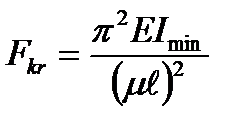
We get the critical force by solving the equation (1):
 (2)
(2)
where  - is the bar length,
 - is the coefficient dependent upon the way of clamping the bar ends. Some types of the bar ends clampty and the corresponding coefficient values are shown in Fig.2.
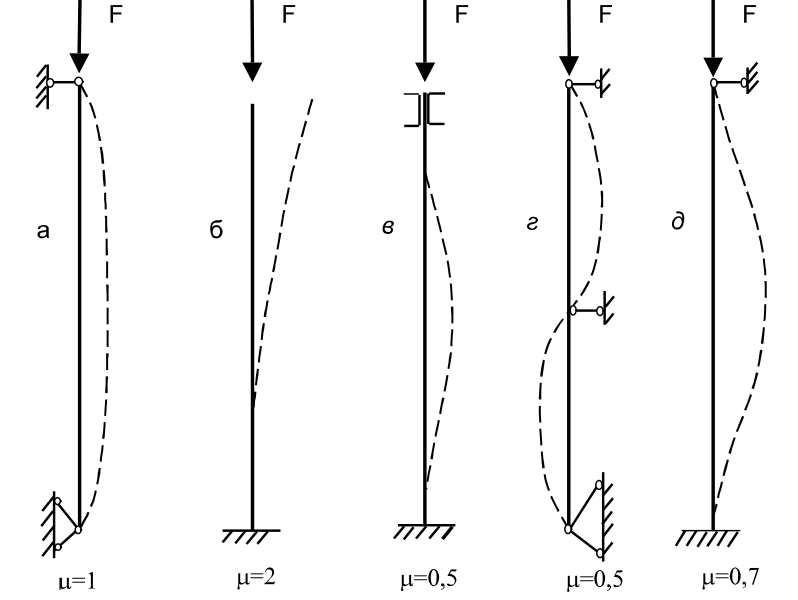
Fig. 2. Schemes of the bar ends clampty
On the basis of the above given notions, the experimentally determined Fcr value differs from the one calculated by the formula (2). The reason is the initial imperfection of the testing specimen. The initial bar deflection is referred here, the eccentrical force action on account of the variable cross - section along the length of the bar and the support construction, the material heterogeneity. That is why to experimentally determine the critical force Fcr, it is reasonable to apply Southwell’s method, which makes it possible to decrease the influence caused by the initial imperfections essentially. It should be kept in mind, that in real cases even with the loads lesser than the critical ones, we are to have the bended equelibrium shape of a bar.
Let us consider Southwell’s method on the example of a pin-ended bar with a primary deflection (Fig.2a). The experience shows that the initial axis shape of the curved bar before its loading can be with sufficient accuracy given by the equation
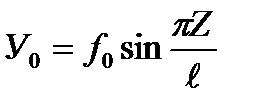 (3)
(3)
where f0 is the initial bar bending deflection,
Z is the distance between the section and the coordinate origin,
 is the bar length.
Let us assume that the additional bar deflections У 1, caused by the action of the compressive force F, also change all along its length by the sine law
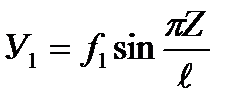 (4)
(4)
where f1 is the additional bar deflection. Then
У=У0 + У1 (5)
Let us substitute into the equation (1) the expression (5) and then having solved it as related to f1, we get
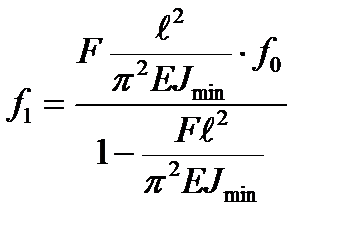 (6)
(6)
Considering the formula (2), it follows
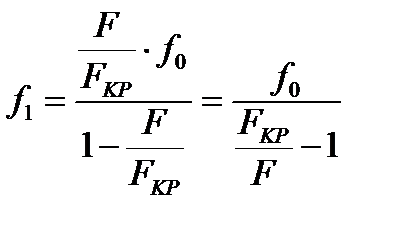 (7)
(7)
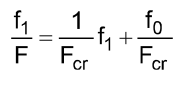
Let us divide the left and right parts of the expression (7) by  and transform it to the form
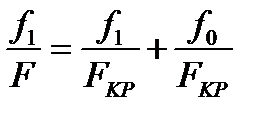 (8)
(8)
When conducting the experience we measure the deflection, depending on the force change F i.e. we receive
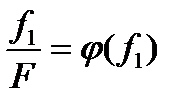 (9)
(9)
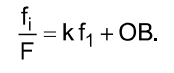
Comparing the expressions (8) and (9) we can conclude that the expression (8) is the equation of the straight line with the angular coefficient
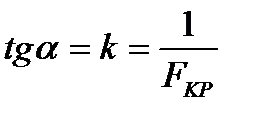 (10)
(10)
cutting on the piece on the ordinate axis
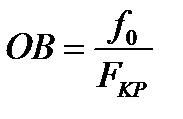 (11)
(11)
кр
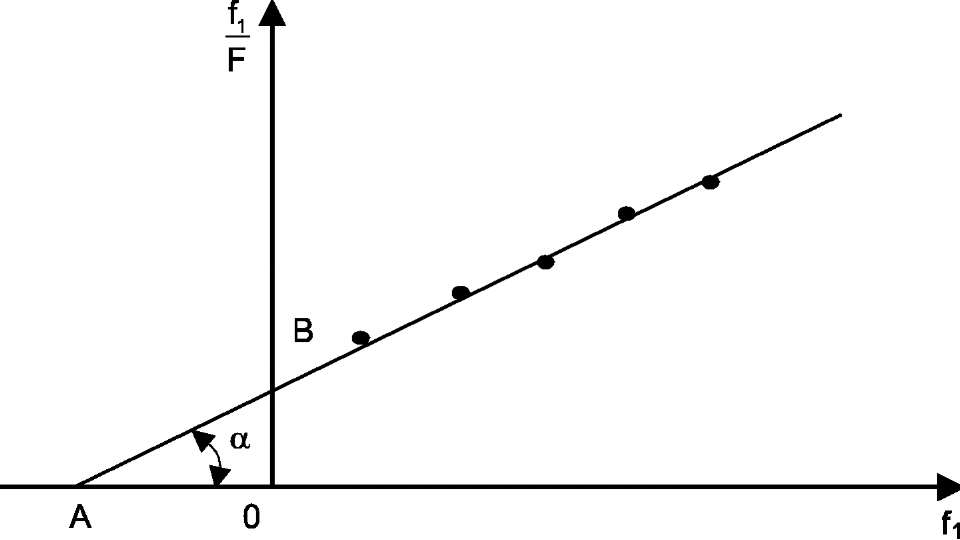 Fig.3. The relation graphic given by the formula (9)
|
This straight line is shown in Fig.3.
From formula (10) and Fig.3 it follows that the value of the critical force
 (12)
(12)
We can also obtain an analogical result with the eccentricity load.
Installation
An installation for testing elastic buckling of a pin-ended bar is shown in Fig.4.
Bar 1 loading is realized by the lever 6 allowing to decrease load values. Lever 6 runs through the slot in the frame upright and rests on the prism providing a pin joint. The weight of the long lever 6 with the load bracket 7 is balanced by the counterweight 5. The lower bar end 1 is rested on sole 2, the upper end is fixed in slider 3, which is freely sliding, relative to frame 4 along the director, vertically. The pin-ended bar is ensured by this construction.
The installation functions in the following way.
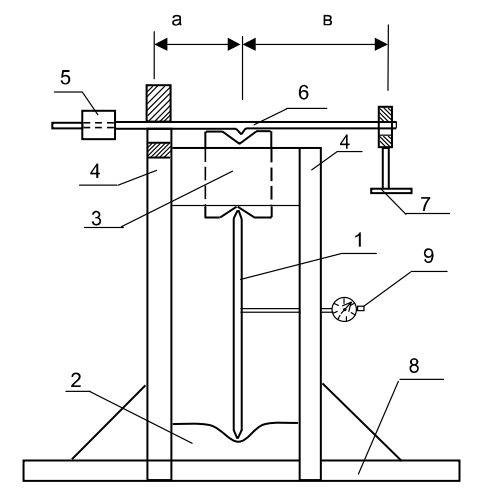
| Fig.4. Installation for testing the bar elastic buckling |
Fig.4.
The loads installed on bracket 7 by lever 6 compress the bar 1. Indicator 9 will show the value of the deflection  under any load due to the initial deflection and a centrical force action. The value of the compressive force is determined by the lever rule:
where  is the load weight installed on bracket 7;
 is the bracket weight 7, lever 6, counterweight 5 and slider 3;
a, b are the lever arms (Fig.4).
Testing specimen
Testing bar 1 with a rectangular cross-section is shown in Fig.5. The bar ends are sharpened to ensure a free turn of the butt-end section.
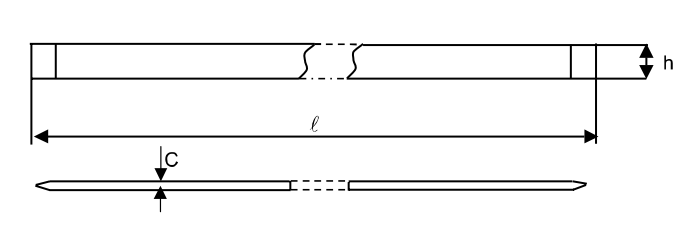
Fig.5. Testing specimen
Order
Make the following operations to determine the critical force using Southwell’s method:
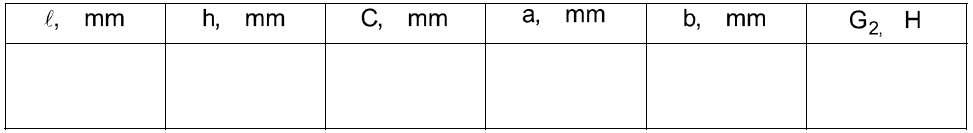
1. Measure the  length and the dimensions of the bar section h and c. Make three measurements and write down the average values in table № 1.
2. Set up the bar in the installation.
3. Balance the system by couterweight 5 so that lever 6 was in a horizontal position.
4. Measure the lever arms a and b, then put them in table 1.
5. Measure the weight G2 of bracket 7, lever 6, counterweight 5 and slider 3, write these down in table 1 (for the given installation G2 is equal to 48 N)
Table 1
5. Set the indicator hand to "O".
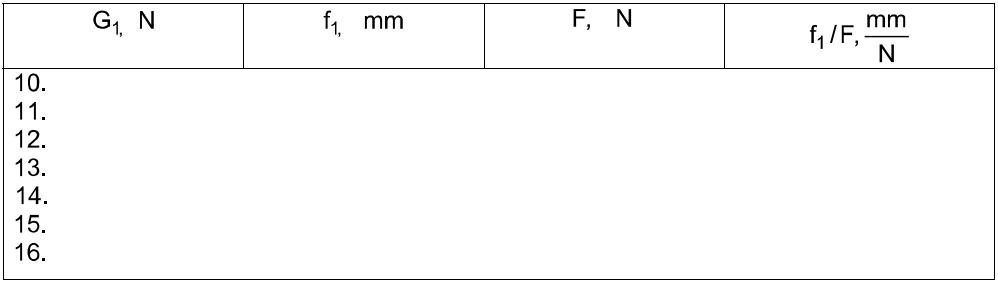
6. Place the weight G1=10H on bracket 7, take the indicator f1 readings and write down these in table 2 for each level.
7. Carry out the stepped loading in 1 N (100gr), take the reading of the indicator f1 to fix in table 2 for each level.
Table 2
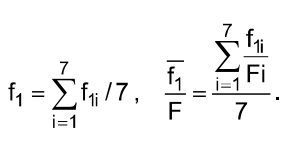
9. By the results of the experiment carry out the following:
9.1. Fill in table 2 using the formula (13) and table 1.
9.2. Calculate the value  using table 1 and the formula (2) with E=210 G Pa and
  =2, then put them in table 3.
9.3. Draw a plot (see Fig.3) with table 2 data. Draw a straight line so, that as many experimental points as possible, be near it.
9.4. Determine the critical force  using the formula (12) and put it in table 3.
9.5. Determine the critical force using the method of least squares, [3]. Let us write the equation (8) in conformity with (9), (10), (11)
or
That is the straight line equation (see Fig.3). From the experiment (Table 2) we have some equations
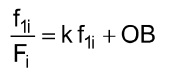
where i =1,2...7 corresponds to each load case G1.
The values k and OB are occasional and they will be the most probable (the straight line will be the best), if the sum of the difference squares is minimum
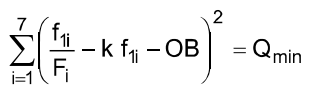
or from the condition

we determine k and OB. After transforming we get
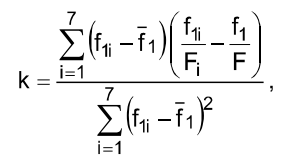
where
The critical force is

Carry out the calculation and put it in table 3.
9.6. Determine the percent divergence in formula (14) and put in table 3
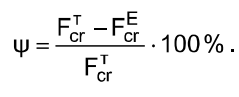
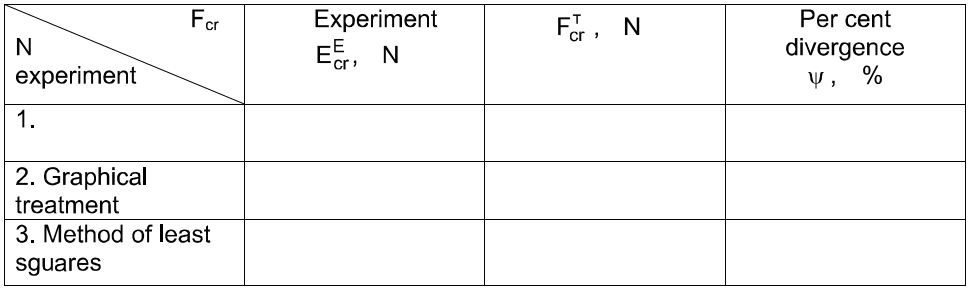
Table 3
Report
The report must include:
1. The title page.
2. The goal of the work.
3. The description of the installation.
4. The test results.
5. Test questions answered.
Test questions
1. What is elastic buckling?
2. What compressive force value do we call critical?
3. What formula can be used to determine the value of the critical force?
4. Point out the domain of Euler formula application.
5. How does the bar end character influence on the critical force value?
6. Point out the formula to calculate the slenderness ratio of a bar.
7. What do we call the limiting slenderness ratio of a bar?
8. What material characteristics do you have to know to calculate the liming slenderness ratio of a bar?
9. What practical value does the critical bar determination of compressive bars have?
10.Does the critical force value depend on the material elastic property?
11.How many times does the critical force change if you replace the pin-ended bar by a bar damped at each end while testing?
12.The essence of the least squares method.
LITERATURE
1.Wiliam A.Nash. Theory and problems of strength of materials. Third edition. - New York: Schaum s outline series, 1994, - 424 p.
2.Feodosiev V.l. Strength of materials. - M.: Science, 1986. - 512 p.
Дата добавления: 2020-10-25; просмотров: 686;
Поиск по сайту
Публикации по технике и механике
Публикации по биологии
Публикации по информатике
Публикации по строительству
Публикации по физике

Публикации по химии
Публикации по электронике

Публикации по искусству

Публикации по географии
Публикации по медицине