Laboratory work № 1
“Testing materials in axial tension.
Defining basic mechanical characteristics of the material”
Introduction
When designing machines, mechanisms, pipelines, reservoirs, building constructions it is necessary to know the values characterizing the strength and deformative properties of materials. The values can be received by mechanical testing carried out in specially equipped laboratories by testing machines. There is a variety of such tests: the hardness test, the resistibility to impact, variable loads test and so on. But tension and compression tests are the main.
The purpose of the present paper is to study the material behavior in the process of the tension test and to define its mechanical characteristics, namely the module of elasticity (Young's modulus) E, the proportional limit  , the elastic limit
  , the ultimate (tensile) strength
  , the elongation per unit length after rupture
  , reduction in the area of the cross-section after rupture
  .
.
Theory
Stresses and deformation. The behaviour of metals under the action of external forces is characterized by their mechanical properties which permit to define the limits of load for each material, to value different materials correlatively and to verify the metals quality in factory and laboratory conditions.
By mechanical properties we mean the characteristics defining the behaviour of a metal (or some other material) under the action of external mechanical forces applied.
The force action causes the deformation of a hard body, stresses arise within it.
The stress is an ultimate value. In the simplest case of the axially loaded bar (fig. 1, a) stress is the force acting over the unit area of the cross section:

where P is the stress over the cross section by the area A, perpendicular to the specimen axis, along which the force F acts.
In the SI system stresses are expressed by units N/m2, Pa or MN/m2 i.e. MPa. It had formerly been put into practice that a unit is kgf/mm2 (1 kgf/mm2 = 9.81 MPa).
In a general case the force is not perpendicular to the section plane it acts upon. Then, according to the vector rules, the force can be decomposed into two components: a normal force (perpendicular to the section plane), making a normal stress and a shearing force, acting in the tangential direction to the plane and creating a shearing stress (Fig. 1 b, c).
These stresses are determined by the mechanical testing of materials. Also the same tests are used to determinate the efforts necessary for the treatment of metals by pressure and to calculate the strength. It is due to the fact that at deformations and ruptures some processes are determined by shearing stresses (plastic deformation, shear rupture), others by normal stresses (tension rupture).
From Fig. 1,c it follows that the resultant stress P acting in the shaded area of the section  and having the angle between the normal to it and the direction of the external force F equals
Since  (A0 is the area of the section perpendicular to the tension axis), then
Thus, the normal stress in the section  is
is
and the shearing stress is
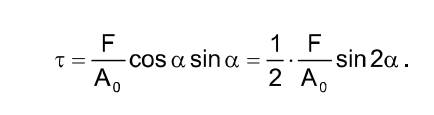
From equations it follows that the maximum normal stresses in the axially loaded bar arise at a=0 i.e. at the plane perpendicular to the tension axis and the maximum shearing stresses arise at a=45°.
Normal stresses are subdivided into tension (positive) and compression (negative) ones.
Stresses used in mechanical testing can be true and conditional. It is known that the area value, where stresses act (the cross sectional area of the sample), changes in the deformation process. If these changes are not taken into consideration, and the stresses are valued as the ratio of the current load to the initial cross sectional area, the stresses are called conditional. If the stress is the ratio of the force to the fact value of the section at the deformation moment, then the stresses are called true. Only true stresses have a physical meaning but in practice conditional stresses are more convenient to use.
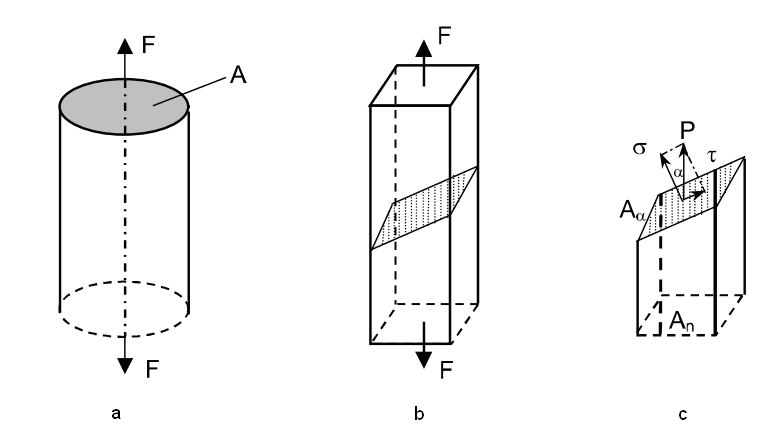
Fig. 1. Formation of normal a and shearing t stresses in cases of applying the force F to the area A: a - the force is perpendicular to the section;
b, c - the force is not perpendicular to the section.
Under the action of external loads, the body is deformed, as the result its form and dimensions may change.
A deformation is termed elastic if it disappears after the load is entirely removed.
Under the elastic deformation there is a reverse atoms displacement from equilibrium of the crystalline space. Elastic deformation does not cause either a visible residual changes of the structure or the property of a metal. The removed atoms under the action of repulsion (in compression) are returned to the initial position, when the load is removed and bodies receive the initial form and dimensions. Elastic properties of materials are determined by forces of atoms interactions.
When shearing stresses increase over a certain value the deformation remains unreversible even if the load is removed.
Plastic deformation is based on the unreverse displacement of one parts of the crystal relatively to others. Only elastic component of the deformation disappears if the load is removed and the plastic deformation remains. Therefore the structure of metals is changed under the permanent deformation unreversely and consequently its properties are changed too.
The plastic deformation is realized by slipping and doubling, whose basis is the dislocation mechanism of a deformation.
A deformation can be finished by a rupture under the corresponding conditions of loading i.e. by full or partial breaking of the body continuance.
 Fig.2. The diagram of a deformation process
|
The basic stages of the deformation process. We can imagine different stages of the deformation process better if we consider the diagram of a body deformation under the action of the increasing load. This diagram is usually plotted with the test results in "deformation - force" coordinates (fig.2). For metals and their alloys the deformation process under the action of a gradually increasing load (static loads) consists of three stages, superposable each other.
1. The stage of elastic deformations (up to point A); the relation between the force and the strain is determined by Hooke’s law and it depends on material elastic properties.
2. The stage of elastoplastic deformations (portion AB); the relation between the force and the strain is determined by a curve, whose character depends on material properties, loading conditions and the choice of coordinates of the deformation diagram.
3. The stage of breaking (portion BC); this rupture in a deformation process is conditional, because it is impossible to differentiate between the described stages. For instance, a plastic deformation of private grains of a polycrystal metal can be found by metallographic and X-ray methods for the area with practically a linear relation between a force and deformation i.e. the microscopic elastic range. This deformation heterogeneity is also conserved for the plastic area. Therefore long before the entire rupture rupture cracks can be found there.
However the distribution of the deformation process indicated above is necessary and appropriate, as it delimits the basic behavioural patterns of materials under a mechanical loading.
Mechanical properties of materials: strength, hardness, plasticity, viscosity, elasticity are determined under different conditions of loading and at different sequences of efforts application. Testing materials in tension is widely practiced because its results help to determine the indices of strength and plasticity of materials.
Strength is the capability of materials to resist to plastic deformation under the action of external loads without breaking.
Plasticity is the capability of materials to develop the risidual deformation without breaking.
Testing in tension is the static testing under which a specimen is loaded slowly and gradually.
The conditions for tension testing and the sequence to determine the results are regulated by the standard GOST 1497-84.
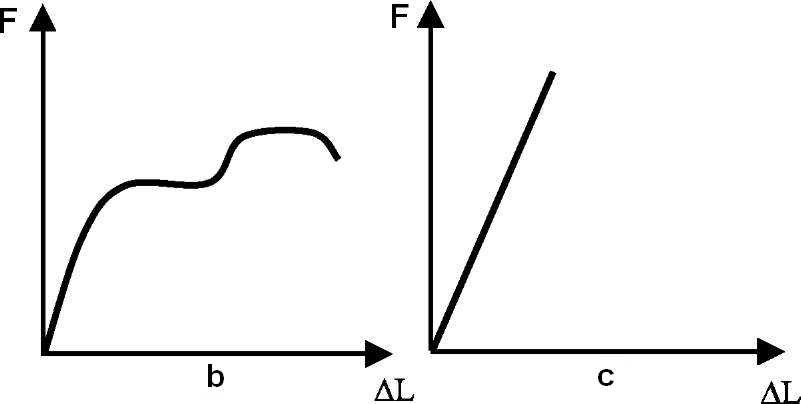
The relation between forces and deformations are written by mechanical or electronic diagram equipment of a testing machine in the form of the curve “F~ΔL”, where F is the tensile force, L is the total elongation of a specimen.
The typical tension diagrams are shown in Fig.3.
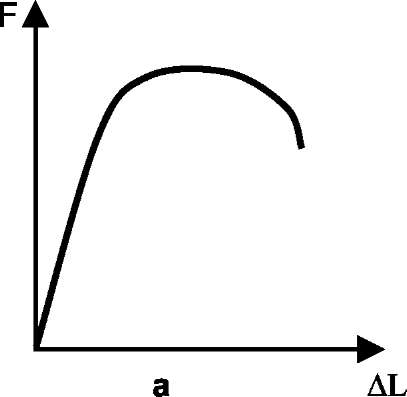 Fig.3. The tension diagrams for different materials: (a) for the majority of metals with a gradual transition from the elastic range into the plastic one (copper, bronze, alloy steels); (b) for some metals with the spasmodic development transition into the plastic range (low-alloy steel, some bronzes); (c) for brittle materials (cast, glass, chilled and untempered steel, silumin)
|
To receive specific mechanical properties of the material, which do not depend on specimen dimensions, a deformation diagram is plotted with coordinates as tension stress  and normal strain
  :
:
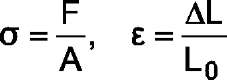
where F is the tension force; A0 is the cross section area of a specimen; ΔL is the total elongation; L0 - is the gage length before the test.
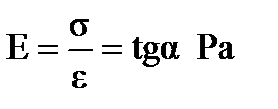
For the elastic range of loading, where there is a linear relation between elongation and axial force causing it (portion 0-Fpr, Fig.4), the basic characteristic is the modulus of elasticity of the material in tension or as it is often called Yound’s modulus:
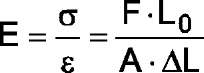
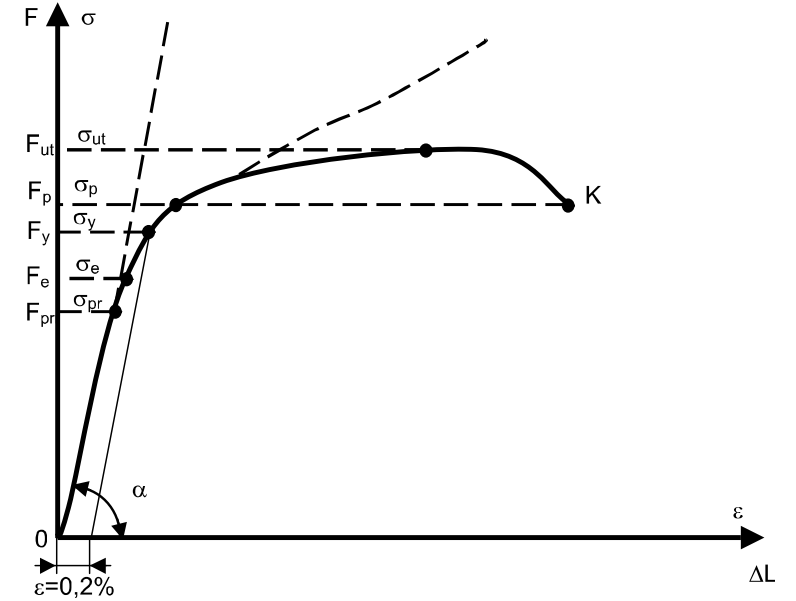
Fig.4. Distinctive sectors and points of the load-extension diagram
The proportional limit  is the maximum stress that may be developed during the tension test, before it there is a direct proportion between the load and the deformation.
The elastic limit  is the maximum stress that may be developed during the tension test, where there is no permanent or residual deformation, when the load is entirely removed. The maximum residual deformation is lesser than 0,05%. For many materials the numerical values of the elastic limit and the propotional limit are almost identical.
The yield (physical) point of the material  is the minimum stress under which there is an increase in strain with no increase in stress. For many materials the risidual deformation equals 0,2% and the stress is denoted as
  .
.
The ultimate strength  or tensile strength of the material is the stress corresponding to the maximum load FВ that the specimen could bear.
The point K in Fig.4 is called the breaking strength of the material.
The following values characterize the ductility of a material.
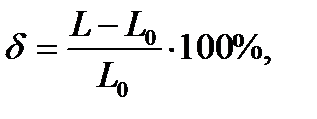
1. The percentage elongation (at breaking) is determined by the relation of the length increase (of the gage length) after the fracture to the initial length:
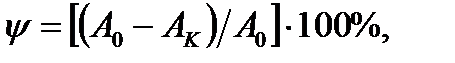
2. The percentage reduction (at the fracture) is determined by the relation of the decrease in the cross-sectional area of the specimen to the original area of the cross-sectional area:

In the research the true ‘stress-strain’ curve is sometimes used, which is received by the replacement in the formula of the initial cross-sectional area A0 by the instantaneous value of the area. Such a curve is shown by a dashed line in Fig.4.
Installation
A universal machine to test materials
To conduct a test special machines and universal electrically driven gear-type or hydraulic machines can be used.
A universal machine of the 1958Y-10-1 type is used in this laboratory work. This machine consists of two units: a loading device, a loading and measuring controlling unit (Fig.5).
The loading device consists of a rigid frame, a traveling cross-bar and two grips for a specimen. The displacement of the traveling cross-bar is realized by the electric motor and worm-gearing.
On the face panel there are two information boards which indicate the current value of the load and the displacement of the active grip. Here there are also installed cross-bar controlling buttons and the speed pointer. The latter is connected with the reduction gear. They ensure the displacement of the active grip in the 0,005+500 mm/min range of velocities. The indicators give information about the condition of the testing machine.
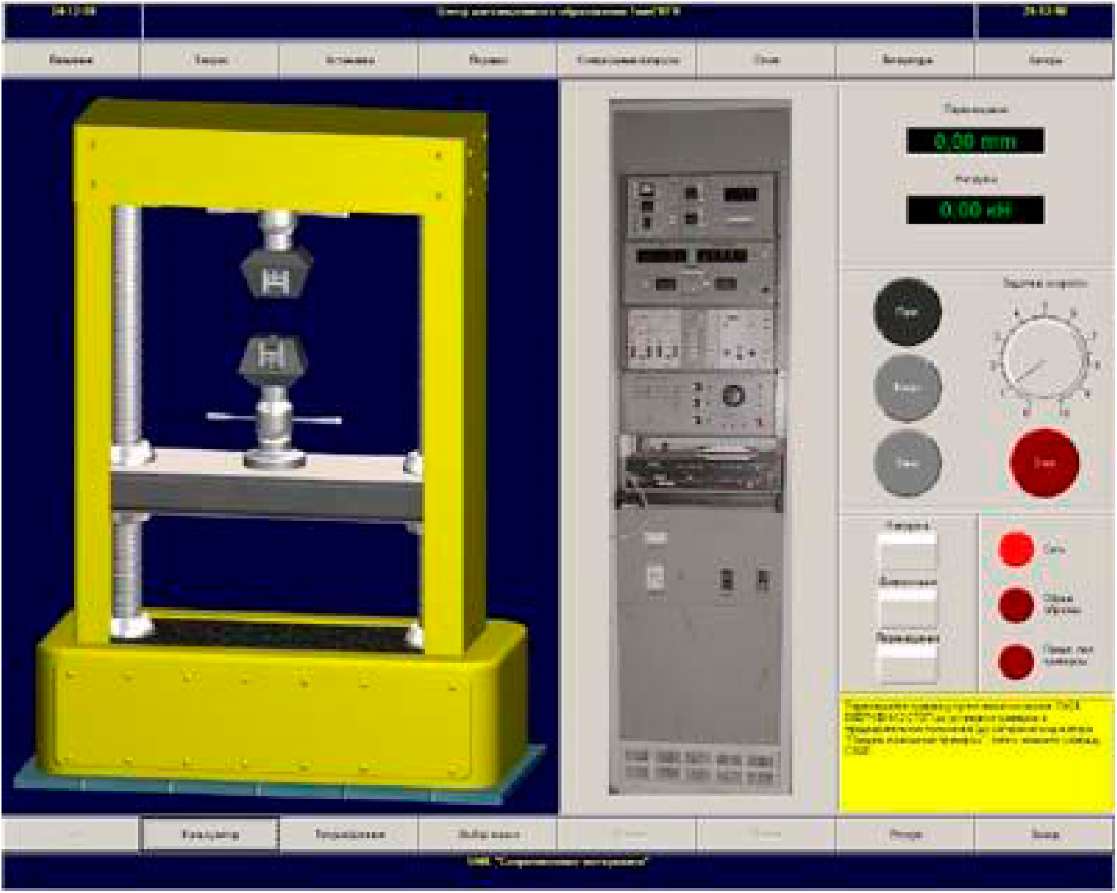 Fig.5. Universal machine of the 19584-10-1 type to test materials
|
Test specimens
The metal specimens used for the axial tension have either a round or a rectangular section.
The dimensions and production standards of the specimens are given in GOST 1497-84. The specific features of the specimens are strengthened places to be installed in the grips of the testing machine, and the gradual change of sections.
While producing specimen from blank parts, certain precautionary measures are taken to exclude any changes of metal properties caused by heating or hardening.
To determine the degree of change of the gage length after the rupture, certain hachures are marked by a dividing machine on the testing surface in every 10 mm all along the length.
The main dimensions of cylindrical specimens are shown in Fig.6 and their values from GOST 1497-84 are given in the table 1.
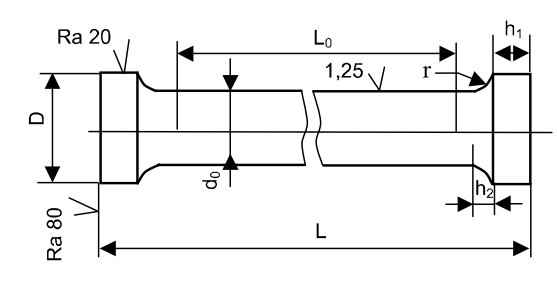
Fig. 6. Types of proportional cylindrical specimens for tensile test
(GOST 1497-84)
| Specimen number | d0 | L_=5d0 | L_=10d0 d0 | D | h1 | H2 | r |
| 2,5 | 1,5 | ||||||
| 2,5 | 1,5 | ||||||
| 2,5 | 1,5 | ||||||
| 2,5 | 1,5 |
Order
1. Study the basic theoretical statements and the conditions to conduct the tensile test, testing machine and specimens.
2. Prepare the testing machine for work: switch on the main switch in the power cabinet, switch on the packet-type switch of the loading apparatus and the controlling unit, switch on the button "POWER", fill the diagram registration unit with the ink and insert a diagram form. All this is done by the teaching-foreman.
3. Choose a specimen you need from table 1 (№7).
4. Place the travelling cross-bar so as you can insert a specimen in the grips. For this you have to press the button "START", then press the button "UP" or "DOWN" depending on the required movement direction of the cross-bar. At the right position of the cross-bar press the button "STOP".
5. Insert the specimen into the grips of the loading unit and cramp it.
6. To eliminate the clearances, apply the initial load of 1,0 kN by pressing the buttons "START", "DOWN", "STOP" in a sequence.
7. Put the zero values on the indicator panel "LOAD" and "DISPLACEMENT" by pressing the buttons "TESTING REGIMES".
8. Conduct the specimen test up to the rupture by pressing the buttons "START" and "DOWN" in sequence. After the rupture of the specimen press the button "STOP". In the process of testing watch the indicator and the diagram registration.
9. Write down the last value on the indicator panel "LOAD" - Fut.
10. Print the diagram "F~ΔL " (Fig.4).
11. Draw the diagram "  " (Fig.4) in a corresponding scale.
12.1 By the diagram " " find the basic mechanical characteristics of the material tested.
Determine the modulus of the extension elasticity from the diagram " ". For the linear region of the diagram (Fig.4) we have
 (MPa)
(MPa)
12.2. Determine the proportional limit  from the diagram "
  ". From the coordinate basic origin (Fig.6) draw a straight line OM coinciding with the initial region of the tension diagram. Then, on the arbitrary value of the stress draw a straight line AB, being parallel to the axis of abscissa. On this line measure off the kn length which is equal to half of the mk length. Through the n point and the coordinate basic origin draw the On line and then draw the CD tangent parallel to it to the diagram. The tangent point determines the target value
  .
.
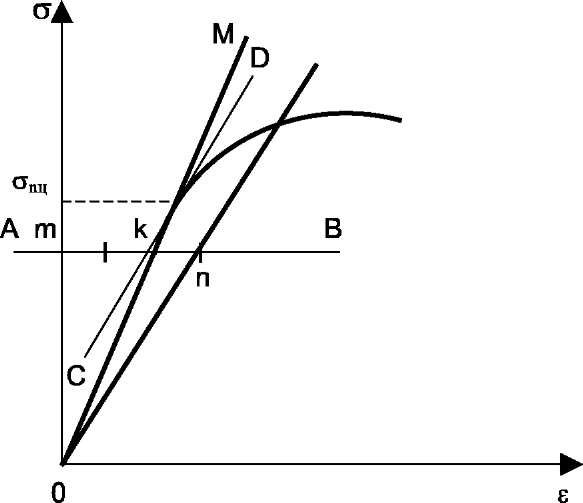
Fig.6. Graphical way to determine the proportionality limit.
12.3. Determine the elastic limit  . On the ‘ ’ axis measure off the residual deformation = 0,0005, then through this point draw a straight line parallel to the linear region of the diagram (see Fig.7). The crossing point of the straight line and the diagram determines the value
  .
.
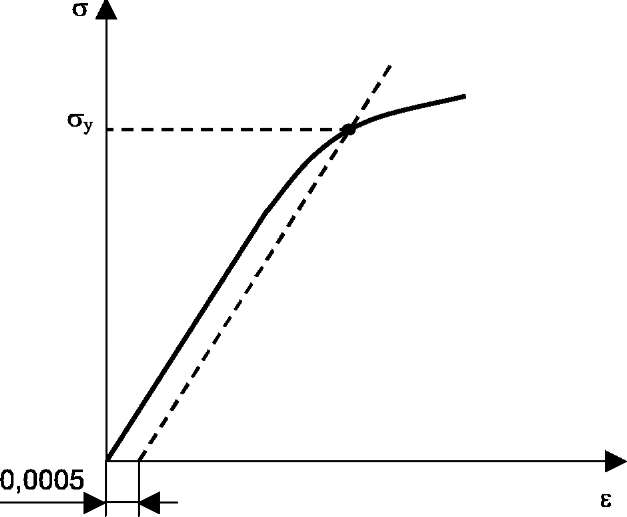
Fig.7. Graphical way to determine the elastic limit
12.4. Determine the yield point  (yield strength
  ). On the “ ” axis measure off the residual deformation =0,002, then, through this point draw a straight line parallel to the initial linear region (Fig.8). The crossing point of the straight line and the diagram determines the value
  (
(  ).
).
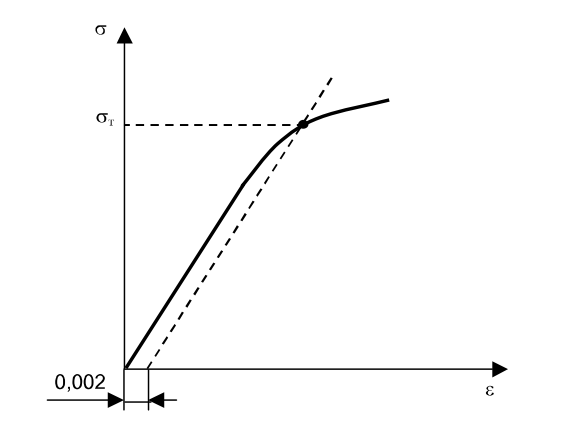
Fig.8. Graphical way to determine the yield point
12.5. The breaking strength  is the maximum value on the " " diagram.
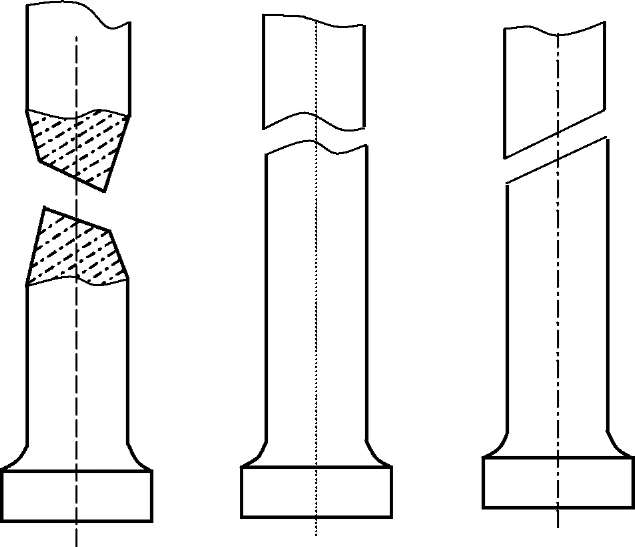
12.6. Determine the nature of the specimen rupture. The typical specimen ruptures of different materials are shown in Fig.9.
а) b) c)
Fig 9. Types of specimen ruptures in tension:
a - necking rupture (low-carbon steel);
b - rupture by separation (cast iron);
c - rupture by cut-off (aluminum alloys magnesium strained)
12.7. Determine the plasticity characteristics.
The relative elongation of the specimen, broken in the middle part of the gage length, is determined by the specimen gage length, marked symmetrically to the middle part before risks testing, and by the total elongation, which is measured after the rupture upon caused risks, as the difference L-L0 (Fig.10). To receive the correlate results in the time of the specimen rupture at the end regions of the gage length, equal sections are drawn in 10 mm, and ΔL is determined supposing that the rupture has taken place in the middle part. The measured length of the gage length has to be calculated from the relation:
L=bc+cf, bc=ab+ac
where ab is the length of the region from the rupture place of the extreme mark b to the direction of the short mark until the mark c; cf is the length of the region from the mark c to the rupture direction of e mark, constituting as many sections as there are in the region from the mark c to the extreme mark f (to the end B).
The percentage of elongation is determined by the formula
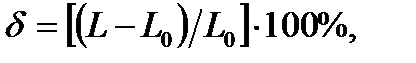
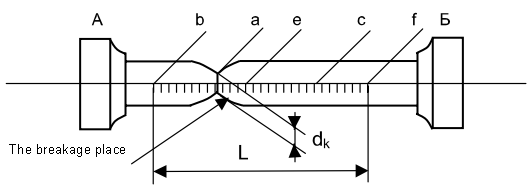
Fig.10. Determining the percentage of elongation and reduction
The reduction in the area of a cylindrical specimen can be determined using the middle value of the diameter in the rupture place, calculated in two mutually perpendicular directions. In the case of testing the plate specimens (GOST 1497-84), as a rule, it is not recommended to determine the value of the reduction in the area. If it is necessary to determine  area of the cross-section area АК in the rupture place, it can determined by multiplication of the maximum length of the specimen in the rupture place m and the minimum thickness n.
The percentage reduction in the area after breaking is determined by the formula
12.8. Determine the grade of the material by the results of virtual testing from table 2, taken from the handbook of materials.
| Material | Е | 
| 
|  ( ) ( )
| 
| 
| 
|
| MPa | % | ||||||
| Steel Ct.3 | |||||||
| Steel H18K9MST | |||||||
| Steel 30XrCH2A | |||||||
| Cast iron C410 | 0,2 | ||||||
| Cast iron B435 | |||||||
| Brass J196 |
Report
The report must include:
1. The title page.
2. The goal of the work.
3. The description of equipment and specimens.
4. Tension diagram and its processing.
5. The testing results.

6. Test questions answered.
7. Conclusion.
Test questions
1. The method to determine the basic mechanical characteristics of materials.
2. What values characterize the material strength and ductility?
3. What distinctive points and regions does the low carbon steel tension diagram have?
4. What are: the proportional limit, yield strength, ultimate strength?
5. Which diagrams of stresses do we call conditional and which the true ones?
6. The units to measure force, stress, deformation.
Literature
1.Wiliam A.Nash. Theory and problems of strength of materials. Third edition. - New York: Schaum s outline series, 1994, - 424 p.
2. Feodosiev V.l. Strength of materials. - M.: Science, 1986. - 512 p.
Дата добавления: 2020-10-25; просмотров: 771;
Поиск по сайту
Публикации по технике и механике
Публикации по биологии
Публикации по информатике
Публикации по строительству
Публикации по физике

Публикации по химии
Публикации по электронике

Публикации по искусству
Публикации по географии
Публикации по медицине