Factors influencing on the fatigue strength
The experiences show that the fatigue strength is subjected by the essential influence of the following factors: the stress concentration, the detail cross section dimensions, the surface condition, the character of the technological treatment and others.
Consider them more detaily.
The influence of the stress concentration. The sharp detail shape change, holes, recesses, cuts and so on decrease the fatigue strength considerably in comparison with the fatigue strength for the smooth cylindrical specimens.
This decreasing is considered by the effective stress concentration coefficient which is determined by an experimental way.
For that we take two similar specimen series (10 specimen in each one) but the first one is without the stress concentration and the second one has the concentration and determines the fatigue strengths under the symmetrical cycle for the specimens without the stress concentration  and for the specimens with the stress concentration
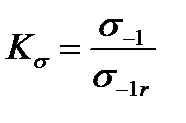
The relation
 (11.9)
determines the effective stress concentration coefficient. The experiences show that this coefficient differs from the theoretical  because the first depends not only on the detail shape but on the material too.
The values  are represented in the reference books. The values of the effective concentration coefficient in bending for the stepped shafts with the correlation
 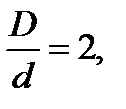 and the transition of the circular radius fillet r is given in Fig. 11.8 as an example. These data were obtained under the specimen test of d =30÷50 mm for steel with the limit strength
  and 1200 MPa. To compare the theoretical concentration coefficient diagram ασ is presented (by the dotted line).
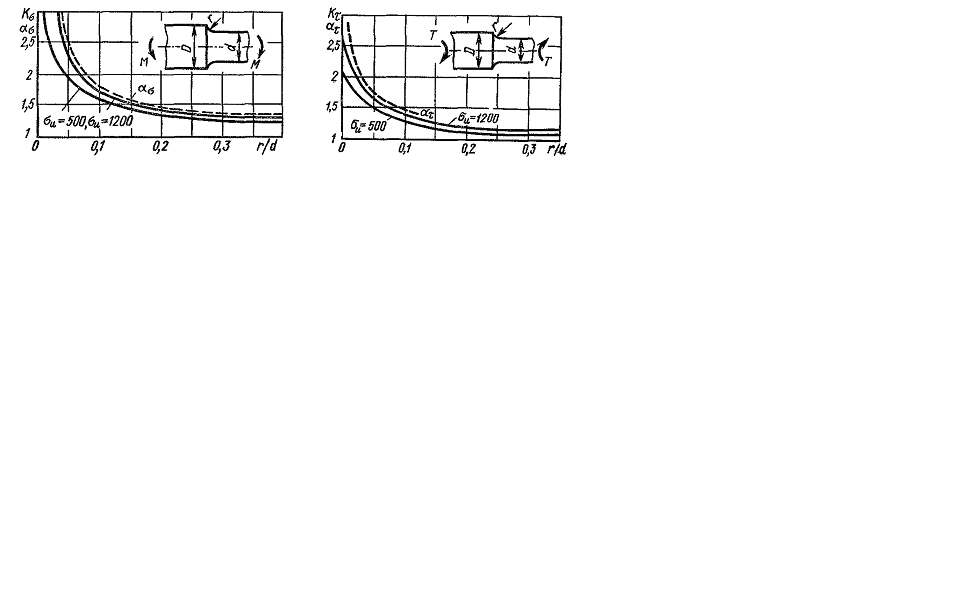
Fig. 11.8. Fig. 11.9.
The value of the concentration coefficients in torsion  and
and  are given in Fig. 11.9 and in Fig. 11.10 - in tension-compression. To determine the effective concentration coefficients under other correlations
| d |
| D |
 (11.10)
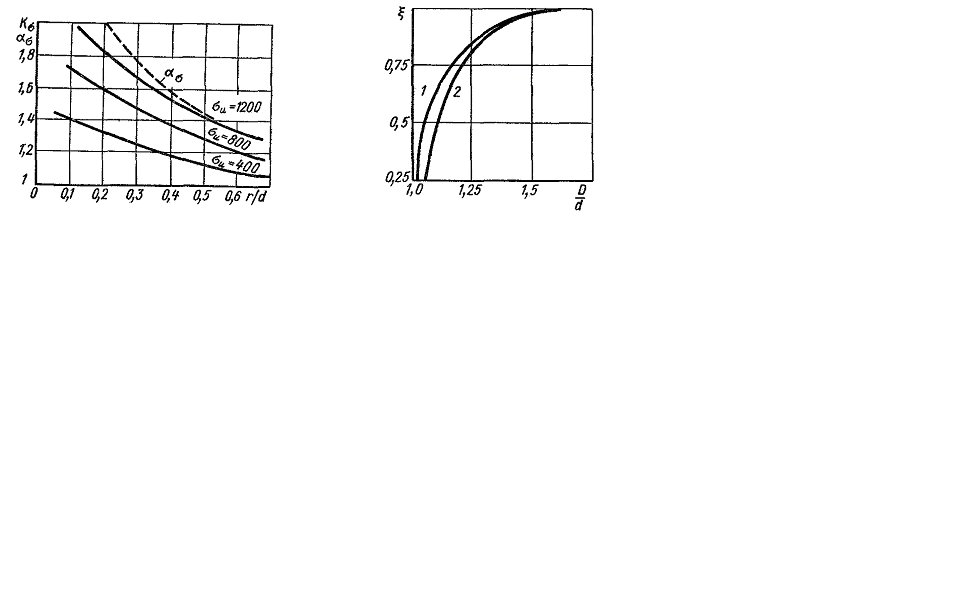
Fig. 11.10. Fig. 11.11.
where  is the effective concentration coefficient corresponding to the correlation
 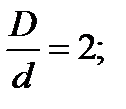 ξ is the correction coefficient determined by Fig. 11.11 thereby the curve 1 gives the value ξ in bending, the curve 2 – in torsion.
The values  and
and  for the shafts with the key slots (one or two) are represented below
 , MPа , MPа
| |||||

| 1,5 | 1,75 | 2,0 | ||

| |||||

| 1,5 | 1,6 | 1,7 | 1,8 | 1,9 |
In the cases when the experience data to determine the effective stress concentration coefficient are missing and the known values of the theoretical stress concentration coefficient are missing, the known values of the theoretical stress concentration coefficient can be used to determine  by the following empirical formula:
  where q is the so-called coefficient of the material sensitivity to the stress concentrations
 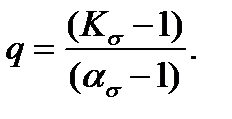 For the high-strength alloy steel the value q is near to one. For the constructional steel on average q=0,6-0,8, whereby for more durable steels it corresponds to larger values q. For the grey pig iron the value q is near to zero. In other words the grey pig iron is insensitive to the stress concentration. More details about q for steel are given in Fig. 11.12.
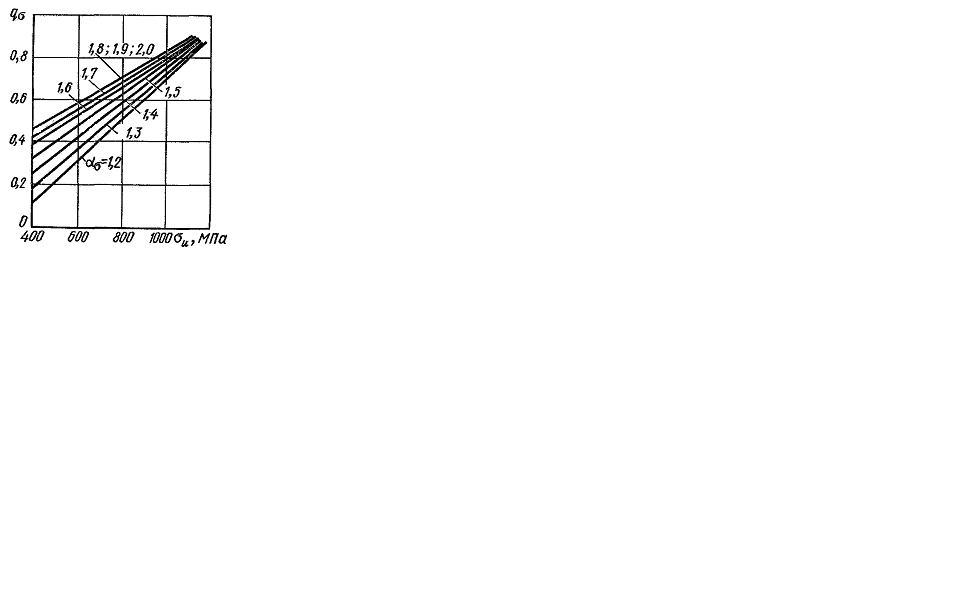
Fig. 11.12.
The influence of the absolute detail cross-section dimensions. The experiences show that the more absolute detail cross section dimensions are, the less the fatigue strength is.
The relation of the details fatigue strength of the diameter d to the fatigue strength of the laboratory specimen of the diameter d0=6÷10 mm. is called the influence coefficient of the absolute cross section dimensions:
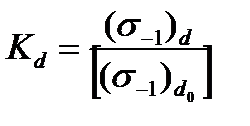 (11.11)
for normal stresses. The influence coefficient of the absolute cross section dimensions can also be determined for the specimens with the stress concentration. In this case we have
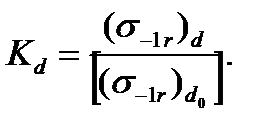 (11.12)
Thereby both the detail of the dimension d and the specimen of the dimension  must have a geometrically similar configuration.
The value diagram is given in Fig. 11.13.
The curve 1 corresponds to the detail from the carbon steel without the concentrator, the curve 2 – to the detail from the alloy steel under the concentrator absence and from the carbon steel under the concentrator presence, the curve 3 – to the detail from the alloy steel under the concentrator presence, the curve 4 – for any steel under the highly large stress concentration (for example under the concentrator of the slot type).
Because of absence of the sufficient quantity of the experience data about the coefficients  (in torsion) one can approximately accept that
It is to be noted that the experience data to determine  are insufficient.
The surface quality influence and the hardness of the surface layer. The experiences show that the rough treatment of the detail surface decreases the fatigue strength. The surface quality influence is connected with the change of the microgeometry (the roughness) and the metal condition in the surface layer that in its turn depends on the mechanical treatment way.
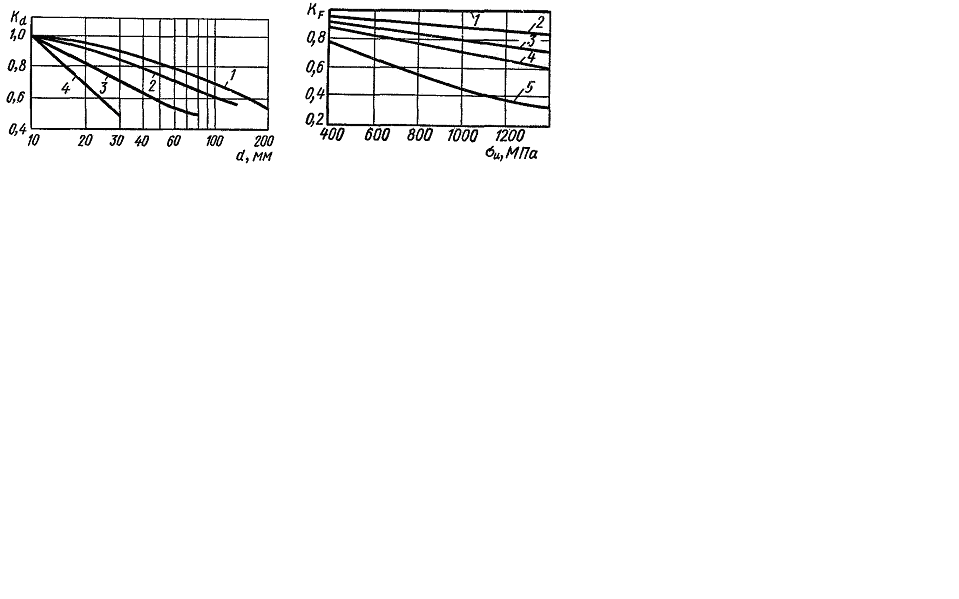
Fig. 11.13. Fig. 11.14.
To appreciate the surface quality influence on the fatigue strength it is necessary to introduce the coefficient  called by the quality coefficient of the surface and it is equal to the relation of the specimen fatigue strength with the given surface roughness
  to the specimen fatigue strength with the surface which is not rougher than
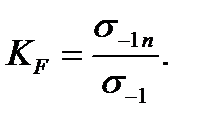 (11.13)
The value diagram  depending on the limit strength
  of steel and the surface treatment form is in Fig.11.14.
Thereby the curves correspond to the following surface treatment form:
1 – polishing, 2 – grinding, 3 – precision turning, 4 – rough turning, 5 – scale presence.
Different ways of the surface hardness (strain-hardness, cementing, nitrogening, the surface hardening by the high-frequency current and so on) increase strongly the fatigue strength value. It is taken into account by introducing the hardness surface influence coefficient  The fatigue strength of the machine details can be increased in 2-3 times by the details hardness surface way.
The coefficient values  can find in the reference book.
Дата добавления: 2020-10-25; просмотров: 680;

