Types of computer GRAPHICS
Three basic principles of presentation of graphic images – bit-mapped graphics, vector and fractal graphics are developed and successfully used. Mathematical models of images are the basis of this or another method. For a bit-mapped graphics there is the array (matrix) of numbers which describe co-ordinates and colour parameters of every point of a picture, for vector graphics there are mathematical formulas which describe geometrical figures (objects) a picture is formed. Fractal graphic art operates mathematical formulas too, and they describe not separate geometrics, but a process of automatic generation of image by equations.
A bit-mapped graphics is applied, mainly, in the development of electronic (multimedia) and publishing editions. For coding a picture is broken up to small monochrome parts. All colors, used in an image, are numbered, and for every part the number of its color is written down. Memorizing the sequence of location of parts and the number of color for every part, it is possible to describe any picture.


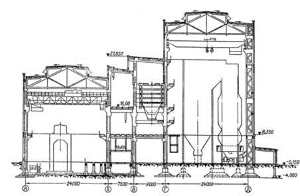
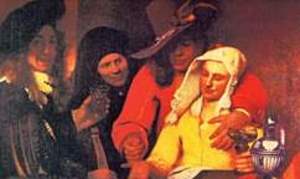
 Illustrations, used by a bit-mapped graphics, are rarely created by hand with the help of computer programs. For this purpose illustrations are used more often, prepared by an artist on a paper or pictures which then are digitised on a scintiscanner (fig. 9.1). Therefore most graphics editors, intended for work with bitmap illustrations, are oriented not on the creation of images, but on their treatment.
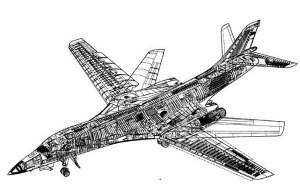
Programmatic facilities for work with vector graphicson the contrary appointed, in the first turn, for creation of images and less for their treatment. In the vectorial method of coding geometrical figures, the curves and lines which make a picture are saved in memory of a computer as mathematical formulas and geometrical abstractions, such as a circle, a square, an ellipse and similar figures. By mathematical formulas it is possible to describe various figures. Exactly vector graphics is used in different computer-aided designs for making and editing of various technical document at implementation of project-designer works (fig. 9.2). Vector graphics is also widely used in advertisings agencies, designer bureaus, editorial offices and publishing houses. Designer works, based on application of fonts and simplest geometrical elements decide facilities of vector graphics far simpler.
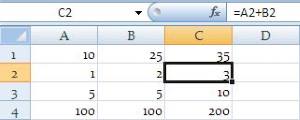
Programmatic facilities for work with fractal graphicsare intended for the automatic generation of images by mathematical calculations. Creation of fractal artistic composition consists not of drawing or registration, but in programming. Fractal graphics arts is rarely applied for creation of printing or electronic documents. The ability of fractal graphic art to design images often is used for the automatic generation of unusual illustrations (fig. 9.3). Fractals are used for representing trees, bushes, designing hypsography or sea surface and etc. in machine graphic art. Fractal geometry is irreplaceable during the generation of artificial clouds, mountains, sea surface. From the point of view geometry, the method of easy presentation of complex objects which shapes look like natural is actually found, because a lot of objects of organic and inorganic nature have fractural properties.

|
9.3.1 Bit-mapped graphics
The principle of coding graphic information in a bit-mapped graphics have been discovered and used by people for many centuries before computers, monitors and scintiscanners. These principle drawing "on cells" are productive methods of transferring the image from a preparatory cardboard on the wall, intended for a fresco. Such directions of monumental and applied art, as a mosaic, stained-glass window, embroidery: in each of these technics the image is made from discrete and coloured elements as a rule.
A computer bitmapped image is represented in the form of rectangular matrix, every cell of which is represented by a coloured point. Being digitised the images is divided into such little cells, that man’s eye does not see them, perceiving the whole image as a unit. A scale got its name of a raster card, from the English word «bitmap», and its single element (a square cell) is named a pixel (from English PICture ELement). A pixel is the smallest element bitmap display which has the address. A bitmap card is a set (array) of three of numbers: two first values are the co-ordinates of pixel on a plane, the third determines its color. With the help of bit-mapped graphics it is possible to represent and pass all range of nuances and thin effects, the real image possesses. Bitmapped image is near to the picture as it allows precisely reproduce basic descriptions of a picture: luminosity, transparency and depth of sharpness.
According to the structure bitmapped images consist of great number of small coloured points. Every pel, as a pebble in a mosaic, is independent from each other. However, the amount of colors in nature is endless, similar colors are numbered by identical numerals. In dependence of the amount of used colors, it is possible to code a more or less realistic image. It is clear, that less colors are in the picture, less numbers are used, and it is more simple to code the image. Only black and white colors are used in the most simple case. For representation of every pixel in a black-and-white picture one bit is enough. A bit is minimum unit of computer’s memory which can keep a value 0 or 1. While working with color it is obviously not enough. However approach to the coding of the colored images remains unchangeable. Any picture is broken up to pixel, i.d. small parts, each of them has its color. The amount of information which describes color of a pixel determines the depth of color. The more information determines color of every point in a picture, the more variants of color exists. If we set the size of a pixel, we can restore the coded picture without any problems. Without defining the size of a pixel, it is impossible to make an image on the basis of the coded information. However the sizes of pixels are not used in practice, but two other sizes are set: size of picture and its discriminability. A size describes physical sizes of an image, i.d. its height and width. It is possible to set sizes in meters, millimetres, inches or any other sizes. But in computer graphics a size is usually set in pixels. Being reflected on the monitor and typed on the printer every pixel appears as a separate point, if the equipment does not do any special transformations. Old monitors, with large grain of kinescope, shows a big picture, and on the modern printer which uses small points, a picture will be very little. And what kind of picture must be in fact? The discriminability of an image is set up for this purpose. A discriminability is a closeness of placing pixels which form an image, i.d. the an amount of pixels on the set segment. More frequently all a discriminability is measured in the amount of points on an inch - dpi (Dot Per Inch). To reflect pictures on the monitor a discriminability from 72 dpi to 120 dpi is used. While typing the most widespread discriminability is 300 dpi, but for high-quality imprints on the modern coloured printers it is possible to use greater discriminability.
The bitmapped images are more often by the scan-out of pictures and other images, by a digital photo camera or by “fascination” of a shot of video survey. Lately for introduction of bitmapped images to the computer digital photo- and video cameras have been widely used. Bitmapped images can be received directly in the programs of bit-mapped graphics.
When scanning-out an image the scintiscanner breaks up a picture to the great number of small elements (pixels) and forms a raster picture. Color of every pixel is written down in computer’s memory by the certain amount of bits. If a picture possesses a discriminability of 800x600, these numbers represent the amount of pixels for horizontal lines (800) and for vertical lines (600). The more pixels are in an image, the best its discriminability is on the screen. The number of colors necessary to paint a separate pixel is determined as two in the degree of N, where N is an amount of bits which keep colour information about a pixel. In a contrasting black-and-white picture every pixel is encoded by one bit. Eight bits image allows to have 256 colors, and 24 bats provide more than 16 million colors in the image, that enables to work with the images of professional quality. Depending on the discriminability of the monitor, images which have 640х480, 800х600, 1024х768 and more pixels can be on the screen. Therefore, large amount of information is the basic problem for using bitmapped images.
Bitmapped images have another very substantial drawback: it is difficult to increase or to diminish them to scale. When diminishing a bitmapped image a few nearby points grow into one, that’s why legibility of small objects on the depiction is being last. The increase of an image makes these points bigger. No additional objects can be seen when increasing a bitmapped image. When increasing a graphic image the size of every point is increased, that’s why a step effect appears. Making an attempt to turn an image slightly, for example with clear vertical striolas, on a small corner, clear lines grow into "steps" and without an increase. It means that at any transformations (turns, down-scaling, inclinations and other) in a bit-mapped graphics it is impossible to do without distortion (it is dictated discrete nature of image).
Nevertheless than bitmapped images are widely used in the computer engineering, because they have certain advantages — simplicity and, as a result, the possibility of technical realization of automation of introduction process (digitisings) of graphic information. There is the developed system of peripheral devices for introduction photos, sliding seats, pictures, water-colours and other graphic originals. These peripheral devices are continually improved, giving possibility of more adequate transformation of images on financial transmitters (paper, to tape et cetera) in a digital form.
No less important advantage of pixel graphic arts there is a possibility to create and process photo-realistic images. It is possible to get picturesque effects, for example, fog or haze, to represent the thinnest nuances of color, create a perspective depth and unsharpness, washed out etc.
Therefore photographs and pictures, entered in a computer, are stored exactly as bitmapped images. Most pictures in a world computer network the Internet is also bitmap files.
9.3.2 Vector Graphics
In order to avoid the problems which arise when using bitmapped images a vectorial method of coding images was invented.
In the vectorial method of coding geometrical figures, curves and lines which make a picture are saved in the computer’s memory as mathematical formulas and geometrical abstractions, such as a circle, a square, an ellipse and similar figures. For example, to code a circle, it is not needed to be broken up to separate pixels, but it is necessary to memorize its radius, coordinates of a center and color. For a rectangle it is enough to know the size of sides, its location and color of sketching. Various figures can be described with the help of mathematical formulas. Some simple figures (geometrics) are used to draw more difficult pictures.
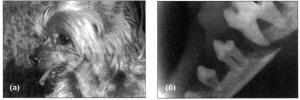
Any image in a vectorial format consists of great number of components which can be edited independently from one another. These parts are named objects. Therefore, sometimes vector graphics is named object-oriented. To combine several objects, it is possible to create a new object, that is why objects can have a complicated appearance. For every object, its sizes, curvature and location are stored as numerical coefficients. Due to this there is a possibility to scale an image with the help of simple calculations, simple multiplying of graphic elements. Thus quality of image remains without changes. For example, when scaling a segment coordinates of supporting points are transferred, but sizes of points which fill an interval between these key points of a segment remains unchangeable. Only number of these points are changed. Therefore, unlike the increasing segment of bit-mapped graphics a vectorial segment remains clear and of high-quality. Figure 9.4 shows the increasing segment made with the help of bigmap on the left figure 9.4, shows this segment made with the help of vector graphics on the right figure 9.4. Using vector graphics, it is possible not to think what we do: prepare a miniature emblem or draw two-meter transparency. We work with a picture quite identically in both cases. At any moment we can scale an image to any sizes without the loss of quality. The vectorial programs are irreplaceable in those areas of graphic arts, where the maintenance of high-quality and clear contours - in design, technical drawing, drawing-graphic and designer works is very important.

a b
Figure 9.4 – Increasing segments made with the help of bigmap graphics (a) and vector graphics (b)
No less important advantage of vectorial method of coding images is that the graphic files of vector graphics have a considerably smaller size, than the files of bit-mapped graphics. It is related to the fact that not an image is stored but some important data, in particular coordinates of supporting and managing points, using which the program reproduces an image for the first time. In addition, a description of colors increases a file size slightly, as given data about color identical to the whole object.
But on the other hand, vector graphics has some drawbacks to be mentioned.
The substantial drawback is programmatic dependence, as there is no principle possibility to create the unique standard format which would allow to open freely any vectorial document in any vectorial program.
As in a bit-mapped graphics a basic display element is a point, so in vector graphics a basic display element is a line which is named a vector, and it got its name from it – vector graphics.
Clearly, there are lines in a bit-mapped graphics, but there they are considered as combinations of points. For every point of line in a bit-mapped graphics one or some barns of memory are taken (the more colors can have points, the more barns are selected for them. Accordingly, the longer raster line, the more memory it occupies. In vector graphics the amount of memory, which needs to be selected a line does not depend on the sizes of a line, as a line appears in the form of formulas and to be more exact in the form of several parameters.
Дата добавления: 2016-07-18; просмотров: 3817;

