Fig. 7. Simple bar chart to show rainfall at a school weather station. Note how the bars are separated.
Histograms
In the case of a histogram, the horizontal axis represents a linked series of class intervals – normally continuous. It is not usual to leave spaces between bars in this instance (see Figure 8).
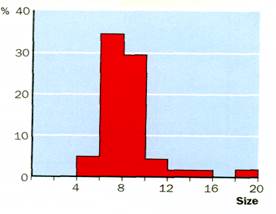
Fig. 8. Histogram showing results from a glacial sediment survey. Note how the к-axis data are linked or continuous.
Bar and histogram variants
Many variations of the traditional bar and histogram exist:
• mirror – bars drawn back to back (see Figure 9);
• population pyramids to show population structure by age;
• reverse bars – bars drawn below the x-axis to indicate a decrease in a particular category;
• proportional bars – show the proportion of change within component categories (see Figure 10).
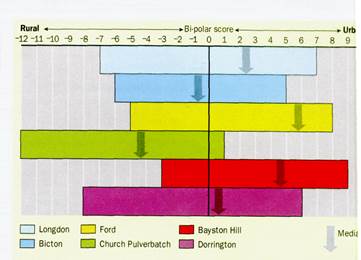
Fig. 9. Bar graph with mirrored bars showing range and median bi-polar scores for various settlements in south Shropshire.
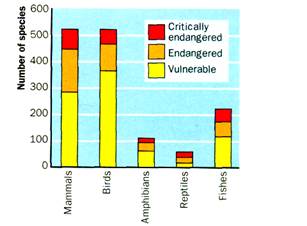
Fig. 10. Bar graph with proportional bars showing endangered animal species in Europe and central Asia.
Scattergraphs
Scattergraphs7 are used to explore the relationship between two variables – the pattern of the scatter shows the strength of the relationship and any anomalies in the data (see Figure 11). It is important to have sufficient data points so that meaningful interpretations can be made (at least 10).
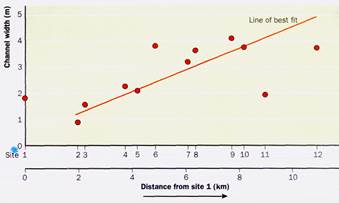
Fig. 11. Scattergraph showing changes in channel width with increasing distance downstream. Note how the sites are not at regular intervals and the results have to be plotted accordingly. Site 11 appears to be an anomaly.
Pie charts
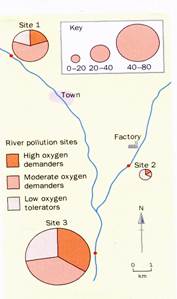
A pie chart8 is a circle divided into sectors proportional to the size of component categories in a given sample. You should use this type of graph when there are at least three but no more than eight different categories to display. It is normal practice to start with the largest category first and work clockwise round the circle in descending order. It is also possible to produce pies that are proportional in size to the size of the sample when comparing different sites or areas. 'Mini pies' can be very effective positioned on a base map (see Figure 12).
Дата добавления: 2021-10-28; просмотров: 766;
Поиск по сайту
Узнать еще
Публикации по технике и механике
Публикации по биологии
Публикации по информатике
Публикации по строительству
Публикации по физике
Публикации по химии
Публикации по электронике

Публикации по искусству
Публикации по географии
Публикации по медицине