Geography and people: Ptolemy
Ancient geography came to an end with the work of Ptolemy, the best-known and most widely acclaimed astronomer and geographer of the ancient world. Little is known about Ptolemy’s life other than that he worked in the Roman Empire’s great library in Alexandria, Egypt, between A.D. 127 and 150. It was in Alexandria, the cultural center of the ancient world, that he wrote his most important work on astronomy. It was so admired, however, that it became known as the Almagest, a combination of Greek and Arabic terms meaning “the greatest”.
“A Guide to Geography”. After completing his work on astronomy, Ptolemy began preparing “A Guide to Geography”, an eight volume work on all aspects of geography. Ptolemy began the work with a detailed discussion of different methods of mapmaking and a lengthy list of all of the known places in the world, together with their latitudes and longitudes. The book also contained 26 colored maps and a carefully planned new map of the world. Ptolemy adopted the grid of latitude and longitude lines developed by the Greek geographer Hipparchus nearly 300 years earlier. This grid was based on the division of a circle into 360 parts. Using this system, every place on the earth could be given a precise location.
The problem of accuracy. Despite its appearance of accuracy, however, Ptolemy’s geography was full of errors. In his time, for example, latitude could only be approximated and there was no exact way of determining longitude at all. Therefore each listing of latitude and longitude was, at best, only a rough estimate.
Besides, Ptolemy greatly exaggerated the size of the land area from Spain to China, vastly underestimated the size of the Atlantic Ocean, and estimated the circumference of the earth to be about half its actual size. Based on Ptolemy’s inaccurate calculations, Christopher Columbus believed that Asia was close to Europe on the west. It was actually Ptolemy’s error that encouraged Columbus to set forth on his westward voyage across the Atlantic Ocean.
A lasting impact. In spite of mistakes made more from the lack of accurate instruments than from ignorance, Ptolemy was extremely well respected. “A Guide to Geography” was such a monumental work that its significance to the development of the field of geography cannot be overestimated. His work remained the major geographic study for nearly 1,000 years.
Components of maps
Despite their variety, all maps have similar components, or parts. These include a title; a legend or key; a direction indicator; and a scale.
The title of a map identifies what the map is about and what parts of the earth is shows. The title of some maps includes a date. Dates are useful on maps showing features that change over time. A map with the title “Distribution of Population in France: 1920”, for example, should not be used when looking for figures on the present population of France.
A legendorkey explains the meaning of colors and symbols used on a map. A map with areas shown in green, red, and blue might be misunderstood unless the user knows what the green, red, and blue represent. The legend also explains the meaning of symbols used on a map, such as stars for capital cities.
Every map should have a direction indicator. One such indicator is an arrow that points north. A different way to find directions on a map is to study the parallels and meridians. East and west directions follow parallels, or lines of latitude. North and south directions follow meridians, or lines of longitude. Parallels and meridians cross each other to form an imaginary grid over the earth. Because each degree can be broken into 60 minutes (`) and each minute can be broken into 60 seconds (``), this grid can be used to fix the precise location of any point on the earth’s surface.
The most important longitude is called the Greenwich Meridian, because it passes through a place called Greenwich in London where there is a famous observatory. The longitude of the Greenwich Meridian is 0 degrees. At Greenwich local time is called Greenwich Mean Time (GMT). All places on the same meridian have the same local time. When it is noon at a given meridian, it is after noon or post meridiem (p.m.) at places which lie to the east of it. This is because the earth rotates from west to east. At the same time the sun will be before noon or ante meridiem (a.m.) at places lying to the west.
Map scales and projections. A map scale provides statistical information used to measure distances on a map. While maps have similar components, they do not always show areas of the world in exactly the same way. The size and shape of North America, for example, may look somewhat different on two different maps. The differences occur because the two maps use different map projections, or methods by which the features of the earth’s curved surface are transferred onto a flat map.
No matter which projection is used, every map has some distortions that are inevitable in the process of illustrating the earth’s spherical surface on a flat map. Certain distortions, however, are worse on some projections than on others. Mapmakers choose which projection to use depending on what undistorted features, or map properties, are most important to be illustrated. The four most useful map properties are correct shape, correct size, correct distance, and correct direction. No world map can have all four map properties. Maps of smaller areas, however, may have less distortion than maps of larger areas.
Maps and graphs
Maps
Well-drawn maps of a suitable scale and type will significantly improve the overall quality of a report. Always remember to include a title, key, north arrow and scale. It is fine to use computer-generated maps, but you should also include some hand-drawn versions to show originality and your cartographic skills.
Isoline maps
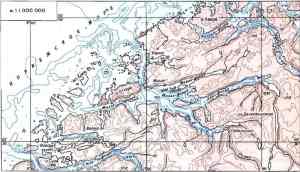
Isolines are lines that join points of equal value (see Figure 1). The best example is contours, usually used to join points of equal height on maps. You may also have seen them used to represent temperature or air pressure. Decide on suitable intervals for the isolines by looking at the range of values. Usually a fixed interval is chosen. Constructing the lines is the hardest part of the exercise and should be done by ‘interpolation’.

Дата добавления: 2021-10-28; просмотров: 656;


